Seeking Hidden Gems

Key Highlights
- A credit rating captures only one element of the risk profile of a corporate debt instrument.
- Where an investment is made in a corporate capital structure is a major consideration, but determining its treatment within the priority of payment queue in the event of a default is not always straightforward.
- We believe augmenting fundamental analysis with legal and structural analysis is critical to identifying attractive opportunities and fully understanding an investment's risk/reward components.
The dream of finding buried treasure has fascinated humans for centuries. Fortune seekers have scoured the earth’s lands and oceans to find diamonds and other precious stones hiding beneath the surface. It can be an arduous task to identify and isolate these commodities from the mineral ore encasing them. It requires knowledge, skill, and patience to effectively screen and separate the valuable from the worthless.
In our view, the prospector’s task is similar to active investing in non-investment grade (also known as “high yield”) bonds and loans, particularly the corporate debt instruments that carry a “triple C” rating.1 This paper will explore the potential rewards and pitfalls of investing in this space.
High Yield Bond Ratings: Three Main “Buckets”
The non-investment grade corporate bond and loan markets comprise issuers that have been assigned a rating of “double B” or below. Exhibit 1 shows the non-investment grade ratings systems used by the two most popular credit ratings agencies: Moody’s Investors Service (“Moody’s”) and Standard & Poor’s Financial Services (“S&P”). For simplicity, this paper will focus on Moody’s data.
Exhibit 1: Non-Investment Grade U.S. Corporate Debt Ratings
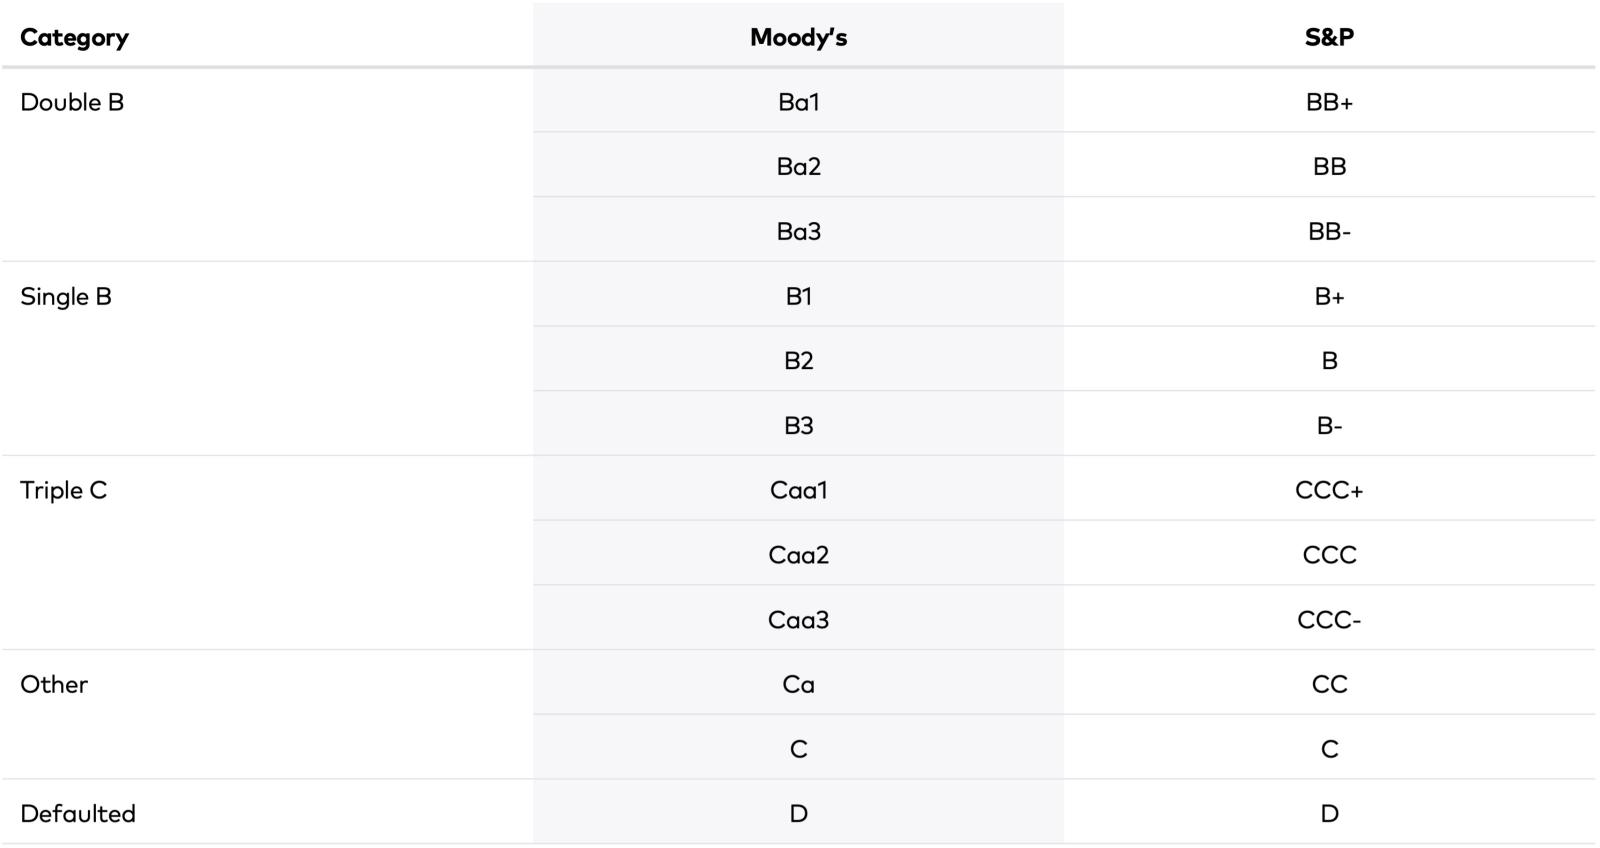
Source: Moody’s, S&P.
Exhibit 2: High Yield Bond Market Characteristics as of June 30, 2024
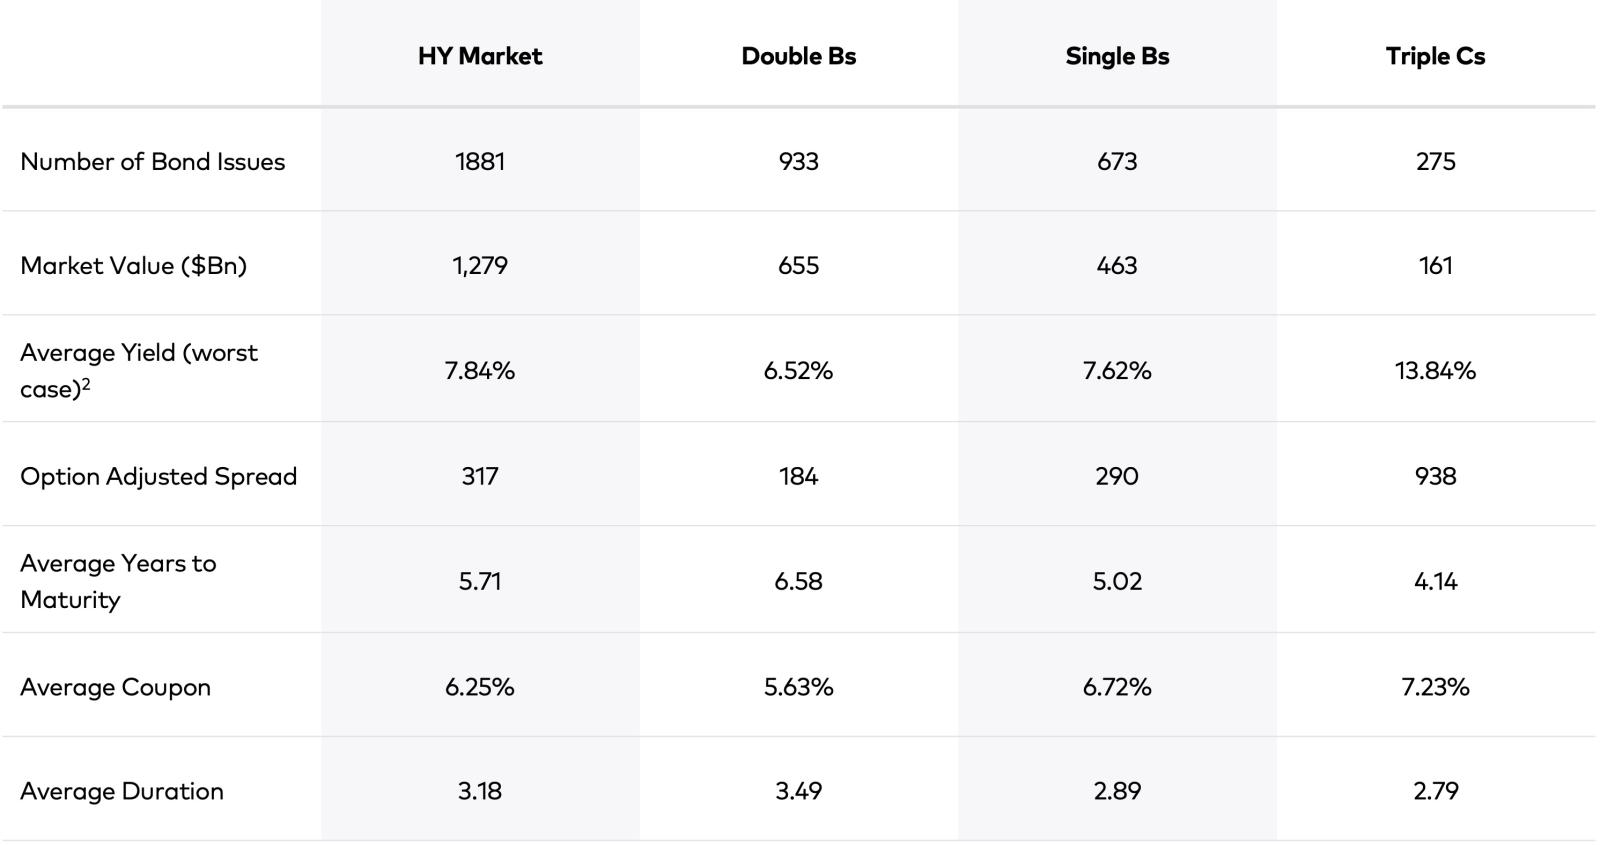
Source: ICE, ICE BofA U.S. High Yield Index2,3
Exhibit 2 shows select characteristics of each ratings category of the ICE BofA U.S. High Yield Index.4
The largest ratings bucket within the high yield universe consists of double B bonds, accounting for approximately half of the entire high yield bond market by market value. Single Bs are second at 36%, with triple Cs representing only around 13% of outstanding high yield bonds by market value.
Each category has distinct features that, in general, tend to influence how the bonds perform during certain market conditions. For example, since investors generally view double B-rated issuers as being of higher credit quality than the other ratings categories, double B issuers are able to issue bonds with longer maturities and lower coupons than the other categories. Such bonds have a high sensitivity to changes in Treasury rates, as reflected by the higher duration. Consequently, during periods of dramatic Treasury rate declines, double B bond returns usually benefit to a greater extent than single B and triple C bonds.
Conversely, triple C bonds generally have shorter maturities and higher coupons (i.e., lower duration) and, therefore, experience less sensitivity to Treasury rate moves, a characteristic that can be particularly attractive to investors during periods of rising rates.
However, triple C bonds have earned their low rating due to the underlying issuer’s increased susceptibility to adverse business events, driven either by macroeconomic or company-specific factors, that may derail it from making promised interest and principal payments.
Triple Cs Under the Microscope
According to Moody’s, a triple C rating signifies that an issuing company’s debt is considered “speculative,” “of poor standing,” and “subject to very high credit risk” concerning the “likelihood of default as well as any financial loss suffered in the event of a default” over the medium term. Moody’s ratings are meant to address two distinct concerns: a) the probability that an issuer will default,5 and b) in the event of such a default, how much principal may be lost.
Not all CCC-rated issuers are the same. For example, companies rated CCC due to elevated current leverage but with a strong growth profile and high cash flow generation can grow into their capital structure and reduce their debt over time.
Conversely, other companies rated CCC that display reasonable current leverage but are facing secular decline as cash flows deteriorate will likely face greater challenges to their survival. Therefore, active managers can employ their mining tools to sift through the overleveraged companies within the lower tier of the high yield universe and unearth attractive opportunities.
Searching for Sparkling Returns in Triple Cs
As Exhibit 3 shows, over the past 25 years, triple C issues generated the highest total return of all the U.S. investment grade (I.G.) and non-investment grade ratings buckets. Although the high historical returns generated by triple C bonds may shine brightly to investors, our view is that the glitter is mostly illusory. While treasure is often present among the mineral scrap heap, we believe that unearthing the “gemstones” lying within takes special knowledge, experience, and hard work.
Exhibit 3: Annualized Returns (%) of U.S. Investment Grade & High Yield Bonds by Ratings Class (January 1, 1999 - June 30, 2024)
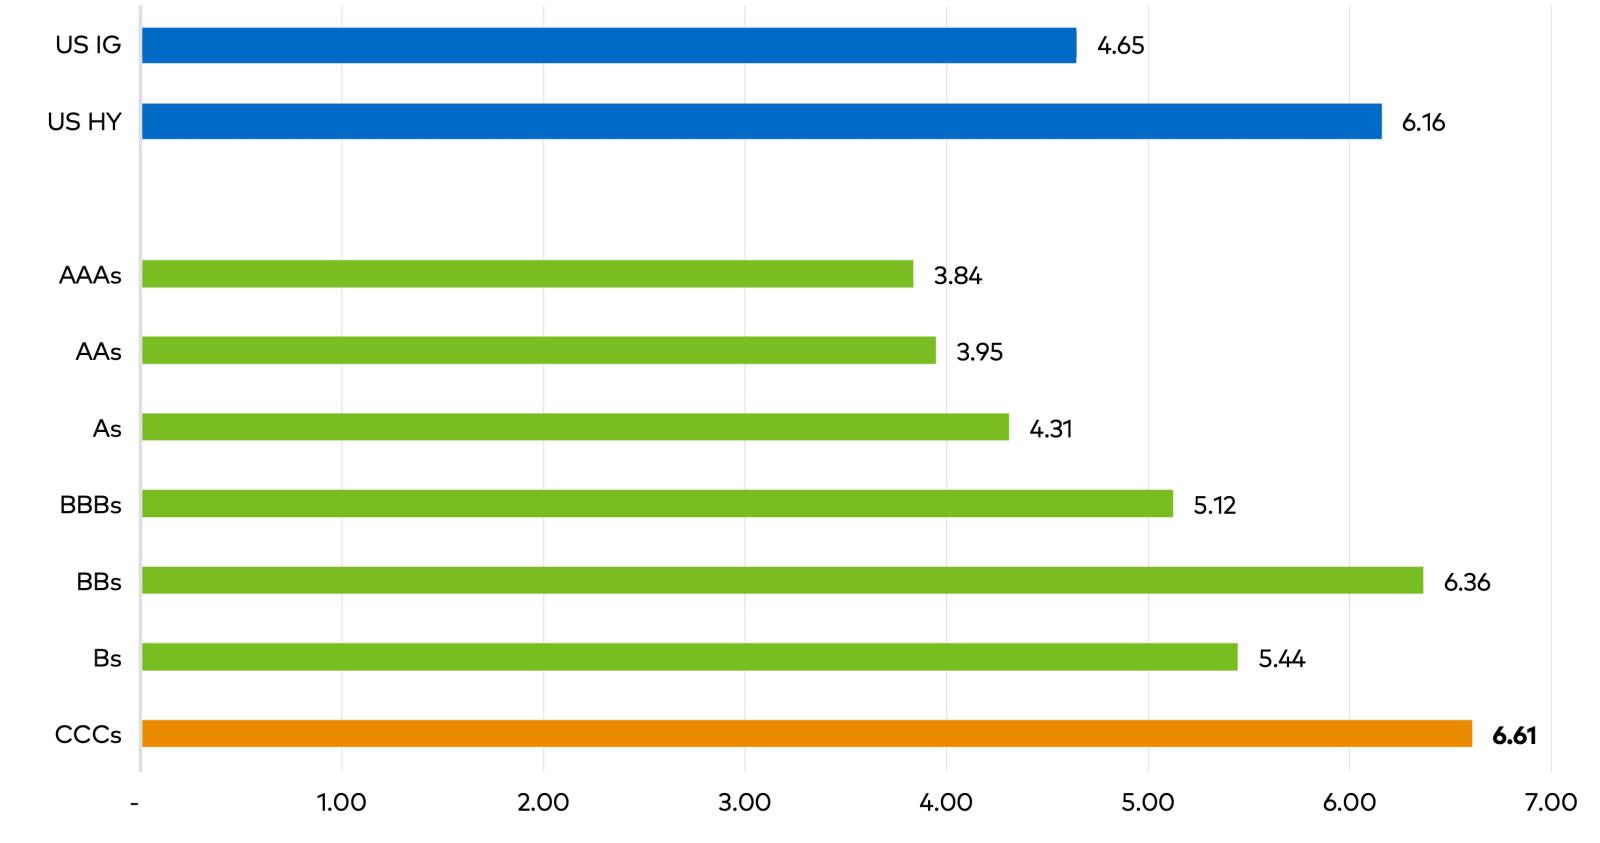
Source: ICE, ICE BofA U.S. Corporate Index, and ICE BofA U.S. High Yield Index
Risk-Adjusting Triple C Returns Reveals Their True Chemistry
Exhibit 4 displays Sharpe ratios for the ratings categories of corporate bonds presented in Exhibit 3. Here, the attractiveness of triple Cs is quite different. When considering the amount of risk, investing in triple Cs may appear to be folly on the surface compared to investments in the other ratings buckets as well as the broader investment grade and non-investment grade universe.
Exhibit 4: Sharpe Ratios of U.S. Investment Grade & High Yield Bonds by Ratings Class (January 1, 1999 - June 30, 2024)
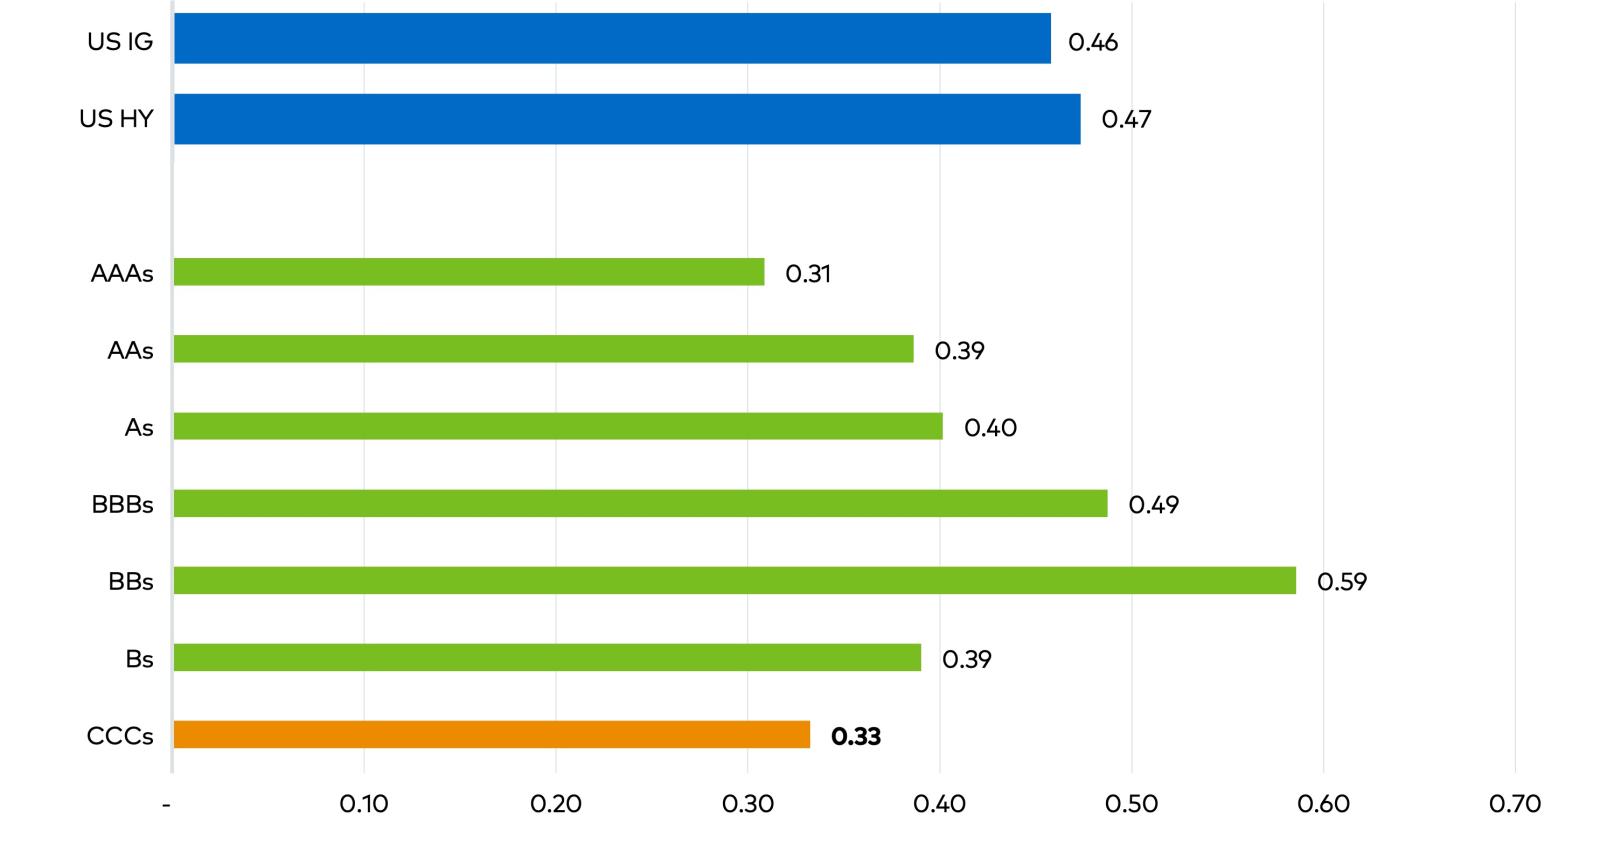
Source: ICE, ICE BofA U.S. Corporate Index, and ICE BofA U.S. High Yield Index.
However, just as diamonds can be hidden in worthless-looking rock, we believe that there can be strong risk-adjusted returns generated by investing in triple Cs, as long as the investor has the requisite knowledge and expertise to uncover the value.
Default & Recovery Rates
Moody’s uses the risk-laden language detailed earlier when describing triple Cs for good reason—in the aggregate, triple C bonds and loans default at a much higher rate than similar investments in the other ratings categories. Exhibit 5 shows default rates by non-investment grade ratings categories, using both the original rating when the debt was first issued and the rating assigned 12 months before the default occurred.
Exhibit 5: Average Default Rates by Ratings Category, 22 years ending December 31, 2023
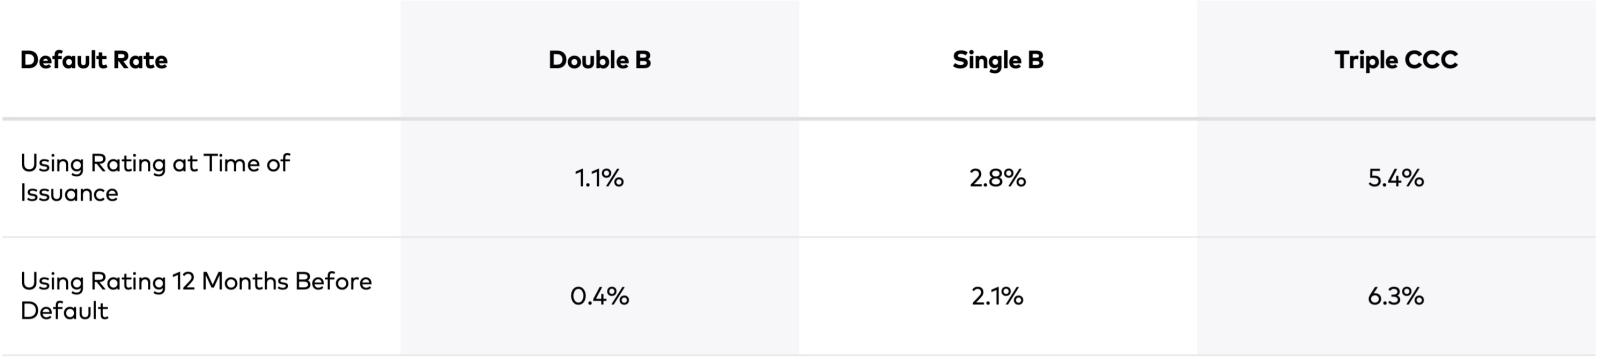
Source: JP Morgan “Default Monitor,” June 30, 2024.
Losses from Defaults
In most cases, a company defaulting on its debt obligation(s) portends capital losses, but sometimes the actual losses are either relatively small or, if the position is held over a long enough period, partially or wholly offset by the instrument’s coupon payments that are received by the bondholder prior to the eventual default. In some cases, a handsome profit may even be generated by a defaulted triple C. In fact, even though a company can have a high probability of default, the actions that a company takes following its default are typically critical in determining whether an investment will eventually be deemed successful or unsuccessful. For example, in the context of a default and balance sheet restructuring, will the issuer’s management team reduce headcount, seek further equity investment, or perhaps discontinue certain operations? Such decisions can significantly affect the ultimate fate of a defaulted investment.
Exhibit 6 shows recovery rates of defaulted bonds broken down by all non-investment grade ratings categories for the period of 1984 to 2023. Interestingly, dispersion of recovery rates by ratings category during this time period is relatively low.
Exhibit 6: Average Senior Unsecured Bond Recovery Rates One Year Prior To Default, 1983-2023
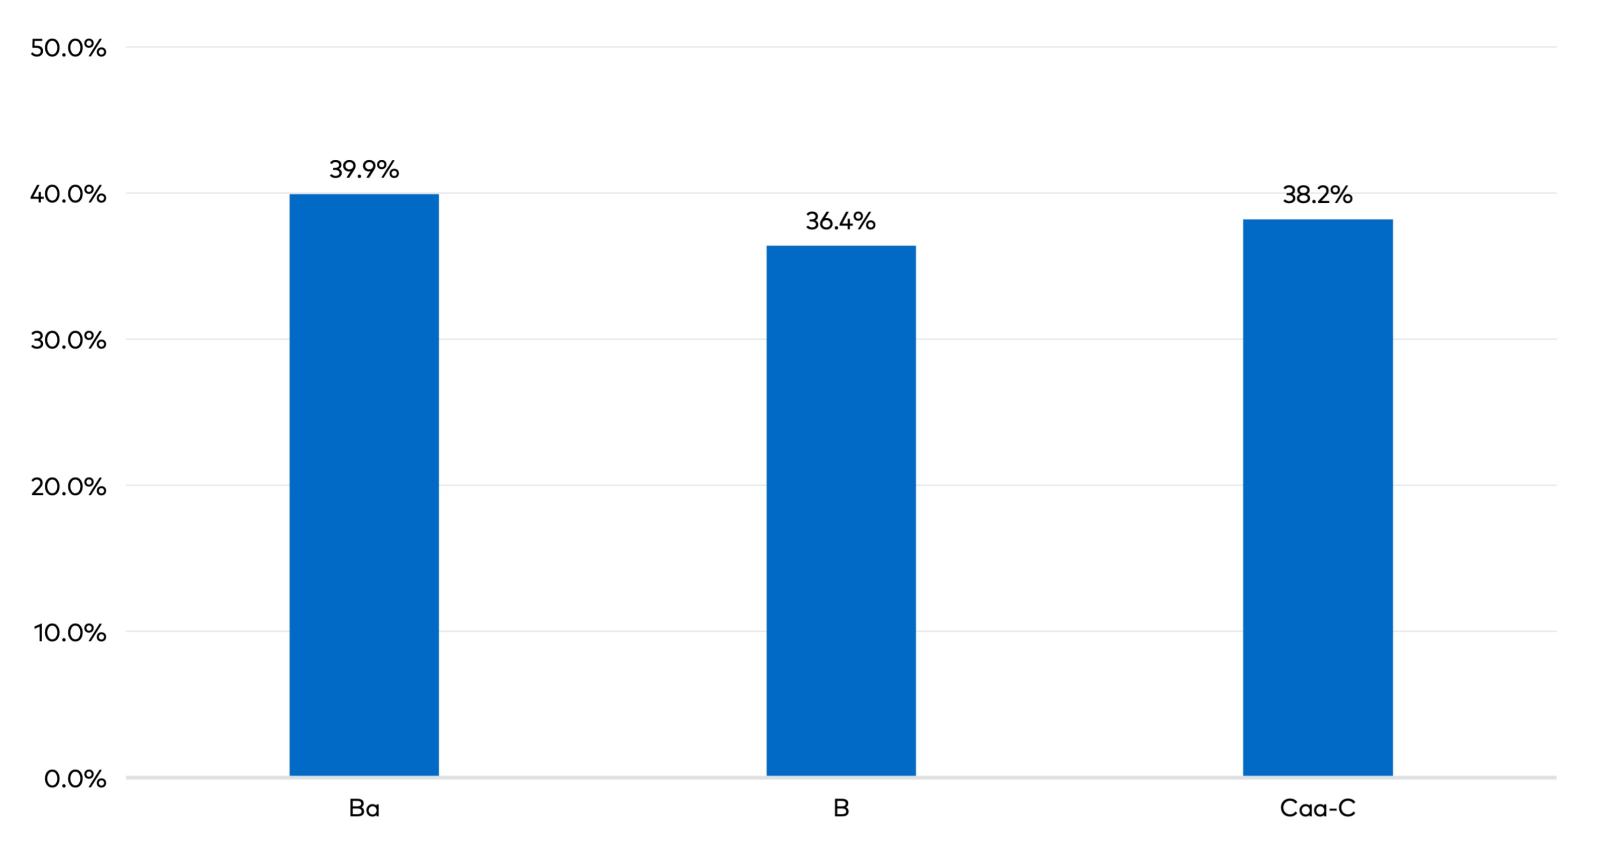
Source: Moody’s Investors Service.
Given the similarity of recovery rates across the ratings buckets as reflected above, it follows that even though Moody’s is generally good at reflecting overall credit quality (and hence, the probability of default) in its initial ratings, such ratings may not be as effective a predictive indicator of actual losses that may be realized after a default occurs, particularly for a long-term investor. In their defense, Moody’s ratings ultimately do an effective job highlighting the incremental risk of principal loss, mostly because the agency, through its own fundamental credit analysis, assesses the probability of default reasonably well amongst the various ratings categories.
With that noted, default losses fail to tell the whole story when assessing the risk of investing in triple Cs, because again, even when these actual losses are factored in, their returns are still attractive relative to the other ratings buckets. This underscores how crucial knowledge and expertise are to finding and exploiting the most favorable reward-versus-risk investment opportunities within this segment of the non-investment grade universe in particular.
The Power of Priority
Corporations typically finance their operations with a combination of debt and equity capital, often by issuing multiple versions, or “tiers” of each, as Exhibit 7 illustrates.
Exhibit 7: The Stratification of a Typical Corporate Capital Structure
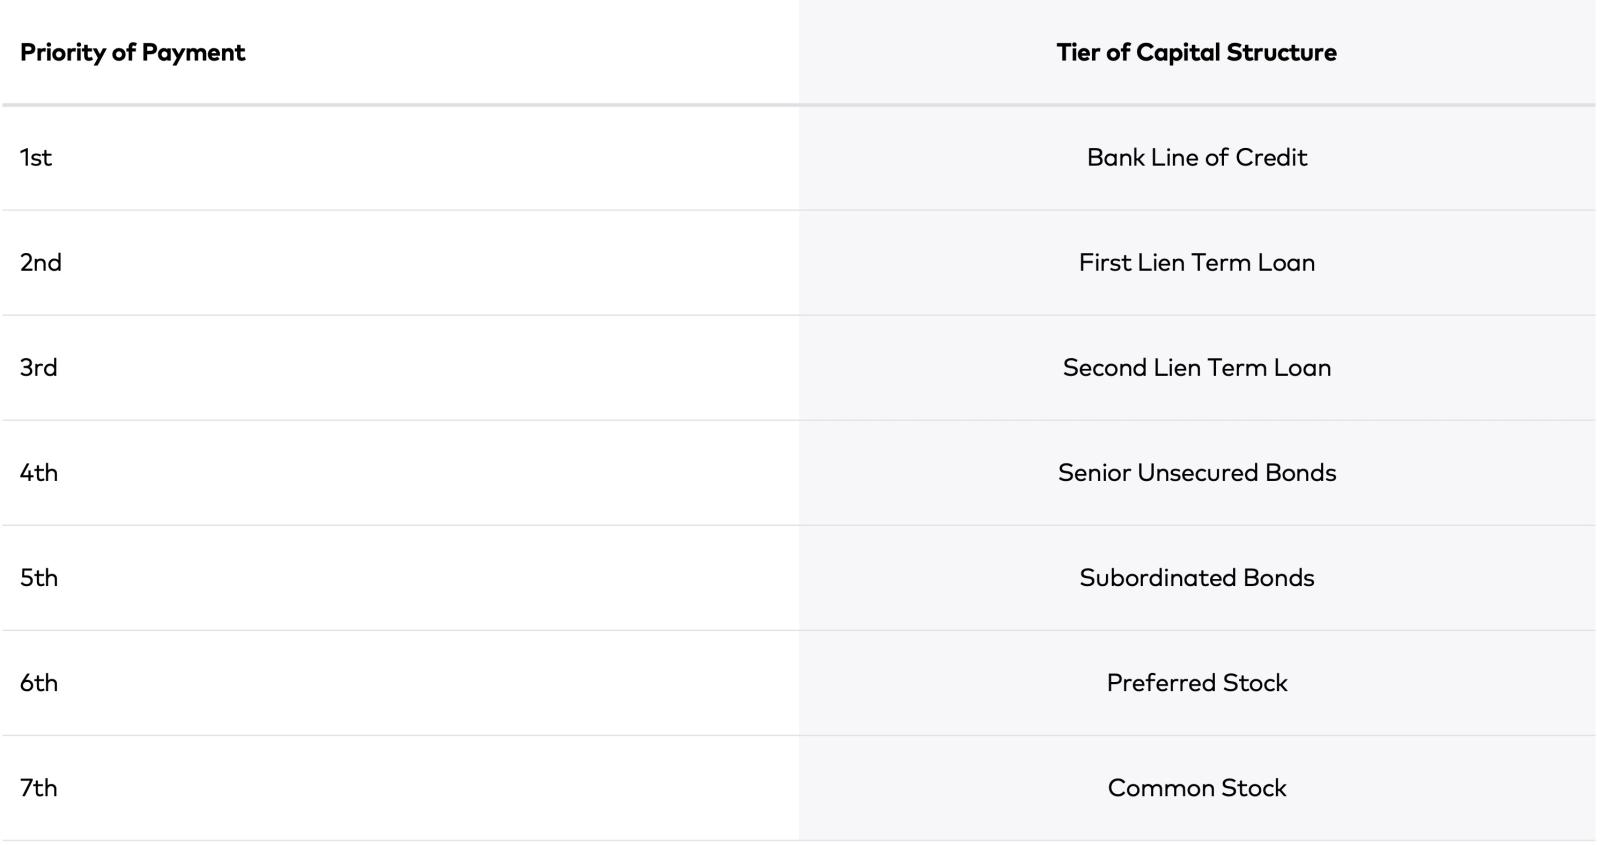
Source: Polen Capital.
Just as miners examine geologic strata to locate and extract value, investors who focus on certain tiers of the capital structure may find that some offer better rewards than others.
For example, investors at the top of the priority of payment queue are typically well protected if a company defaults on a debt obligation and seeks to restructure through the U.S. legal system. In a simple scenario where a company has defaulted on its debt obligation(s) and must be liquidated, the value unlocked through a liquidation would generally be directed to the first-priority creditors until their claim was satisfied. If any residual value remains, payments would then be made to the second-priority creditors, then the third, and so forth, with equity holders at the bottom of any such waterfall (and thus often receiving no value).
Exhibit 8 shows historical recovery rates for the different priority layers of bonds and loans that have defaulted over the period 1983 to 2023. Through this analysis, we can observe a closer relationship between debt characteristics and losses from defaults for all ratings classes, not just triple Cs.
Exhibit 8: Recovery Rate by Position in Capital Structure, 1983-2023
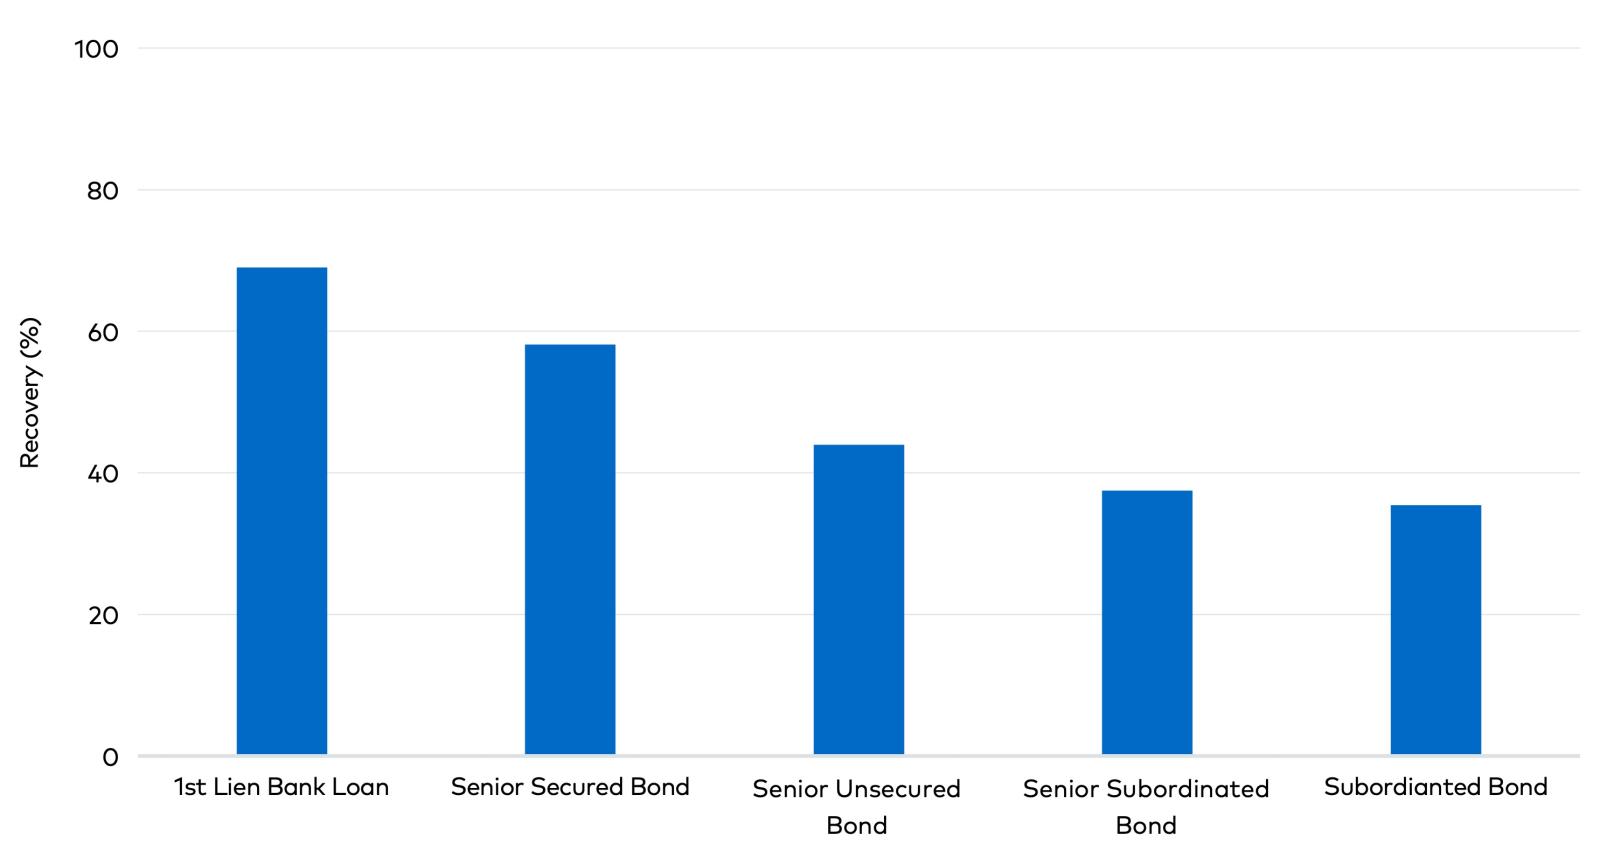
Source: Moody’s Investors Service.
Mining the Layers of a Capital Structure
For many short-term or liquidity-oriented investors, where buy or sell decisions may be heavily influenced by volatile price swings, outright avoidance of triple Cs, which often trade with far less liquidity than higher-rated bonds, can make rational sense. But for long-term investors less concerned with short-term price volatility and the necessity to liquidate an investment at a moment’s notice, there may be attractive opportunities in select issues at the low end of the ratings ladder.
By augmenting fundamental credit analysis with commensurate legal and capital structure analysis, we believe that a prudent manager can identify triple C-rated bonds that provide the potential for strong risk-adjusted returns.
Like the patience of a prospector combing through worthless minerals to find a valuable gem, the depth of an investor’s due diligence is essential.
Key Takeaways
In this paper, we have demonstrated that triple Cs have historically offered higher returns than most other corporate debt classes. At the same time, we have also seen that the risk profile of triple Cs (using commonly accepted measures of risk) is so high that the risk-versus-reward relationship of this asset class appears to be patently unattractive, especially to an investor focused on the short and even medium term. A closer examination of other factors, however, including recovery rates over the longer term, as well as priority of payment, can make the case for a more nuanced view of triple Cs. In this respect, each credit must be analyzed in full for an investor to properly evaluate whether the anticipated reward of investing in a triple C debt instrument sufficiently compensates one for the associated risks.
In our view, for investors to successfully sift through prospects in order to reliably and repeatedly identify a nugget of triple C value as opposed to only a hunk of low-grade junk, a deep knowledge base coupled with extensive experience is critical.
Important Disclosures
1Moody’s Investors Service and Standard and Poor’s Financial Services use a different nomenclature for their ratings system. For example, the Moody’s equivalent to an S&P rating of CCC+ is Caa1. For purposes of this paper, we shall refer to both such ratings as “triple Cs”.
2Includes developed markets.
3Average Yield (worst case) is a weighted average of Yield to Worst for all bonds comprising the index and each of the sub-indices. Yield to Worst is the lower of the yield to call or yield to maturity.
4We use high yield bond data as a proxy for the entire leveraged credit market (high yield bonds and loans).
5A “default” is defined by Moody’s as the failure to promptly pay interest or principal when due but can also include a bankruptcy filing or a distressed exchange. Typically, a company that defaults on an interest payment on a bond has 30 days to cure such default, after which time creditors can elect to pursue remedies, including forcing the issuer into bankruptcy.
This information is provided for illustrative purposes only. Opinions and views expressed constitute the judgment of Polen Capital as of August 2024 and may involve a number of assumptions and estimates which are not guaranteed, and are subject to change without notice or update.
Although the information and any opinions or views given have been obtained from or based on sources believed to be reliable, no warranty or representation is made as to their correctness, completeness, or accuracy. Opinions, estimates, forecasts, and statements of financial market trends that are based on current market conditions constitute our judgment and are subject to change without notice, including any forward-looking estimates or statements which are based on certain expectations and assumptions. The views and strategies described may not be suitable for all clients.
This document does not identify all the risks (direct or indirect) or other considerations which might be material to you when entering any financial transaction. Past performance does not guarantee future results and profitable results cannot be guaranteed.
The ICE BofA U.S. High Yield Index tracks the performance of U.S. dollar denominated below investment grade corporate debt publicly issued in the U.S. domestic market. The ICE BofA U.S. Corporate Index tracks the performance of U.S. dollar denominated investment grade rated corporate debt publicly issued in the U.S. domestic market. Please note that one cannot invest in the index.
Investing involves risk. Loss of principal is possible.
When calculating the credit quality breakdown, the manager uses ratings provided by Moody's, S&P, and/or Fitch. The manager will select the highest rating provided by the designated agencies. If only two designated agencies rate a bond, the rating is based on the highest of the two ratings. If only one of the designated agencies rates a bond, the rating is based on that one rating. Securities that are not rated by all three agencies are reflected as such. A credit rating is an assessment provided by a nationally recognized statistical rating organization (NRSRO), such as Moody's, S&P, and Fitch, which evaluates the credit worthiness of an issuer with respect to debt obligations. Credit ratings are measured using a scale that typically ranges from AAA (highest) to D (lowest) and are subject to changes without notice. Additional information is available upon request.